How to E(valuate)njoy NBA Summer League | The Draft Nerd's Guide to Vegas Hoops
Darryn Peterson is averaging 26.5 points per game on 68 TS% in Summer League. Here's why we should care a whole lot more about his rim rate, AST/USG & Unassisted%.
The NBA Summer League is often many fans' first introduction to the league's newest faces and brightest hopes. It's a time of great optimism (or pessimism!) but mostly...uncertainty, overreactions & sweeping conclusions of a player's NBA viability based on a handful of games played in one of the most chaotic professional environments possible.
From July 3rd through the 19th, highly-touted picks that haven't played since March, sophomores who are itching to prove they're "Too Good[1]for Summer League and fringe NBA players who are fighting for their basketball livelihoods play 10-minute quarters with 10 fouls apiece. This presents the perfect concoction for highly volatile games, especially considering the emphasis coaches put on experimentation, instructing their prospects to try new things, to make that risky pass, all while testing out new playcalls & schemes. In all honesty, the dissonance of Summer League is partially why I enjoy watching every year.
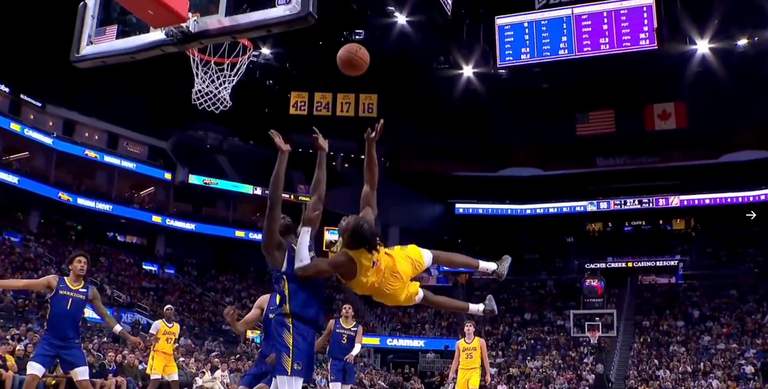
Adou Thiero.
It's that same dissonance however, that makes SL an extremely noisy place to evaluate basketball aptitude, to the extent where you could make an argument that it may be best to completely ignore nearly every output a player records.
It’s entirely rational to come to the above conclusion, but thankfully I have an uncontrollable desire to find empirical meaning in virtually everything basketball related. I combed through roughly 10 years of NBA Summer League play-by-play data to determine which scouting heuristics are most persistent through a prospect’s Summer League stint and their rookie season, in an effort to help refine our collective viewing experience & prospect evaluations.
Owen Phillips (formerly of the F5, currently of the Denver Nuggets) is the Socrates to my Plato. The Tony Stark to my Peter Parker. The Kobe Bryant to my Darryn Peterson. That is to say, Owen’s work (particularly his coding tutorials) has been foundational as I searched for ways to become a better basketball analyst and data engineer. I’ve built many of my visualizations using his theme_f5() function, embedded his stylized NBA logos into my own site and integrated Github Actions & DuckDB into my workflow. This article itself is heavily inspired by one of my favorite pieces by Owen, “Summer League Stats You Can Trust”.
Following the 1st few games played in the California Classic/Utah Summer League games, I decided I wanted to tweet a somewhat shameless advanced stats only recap of the opening action. I paired this tweet with correlation charts from Owen’s above article, hinting at the “stickiness” of the stats I cited in terms of NBA translation. In doing so, I realized a few things:
As far as I know, there aren’t any sites that report SL advanced statistics, especially in the earlier tournaments…
So I calculated that tweet by hand, in which I forgot SL games use 10-min quarters which meant I overestimated the rate stats …[2]
Then I decided I should create a formal extension of the 5th Factor to host these advanced stats so I would avoid silly calculation mistakes…
In doing so, I added many of the important scouting heuristics I rely upon to contextualize a prospect’s playstyle which led me to expand the chart Owen blessed the streets with last July.
As Mr. Stark details below, NBA draft evaluation isn’t his focus. Thus, while there were a number of statistics in his initial analysis that I incorporate in the ever-shifting lens I view prospects through (3-point attempt rate, free-throw attempt rate, AST/TO, per 36 box score stats, etc.), there were several that weren’t captured, mostly by the limitations of purely using box-score statistics.
As we’ll see below, the results of my study are exceedingly similar, thus the biggest value of these new statistics are how much more descriptive they are of a prospects’ playstyle.
Process > Results
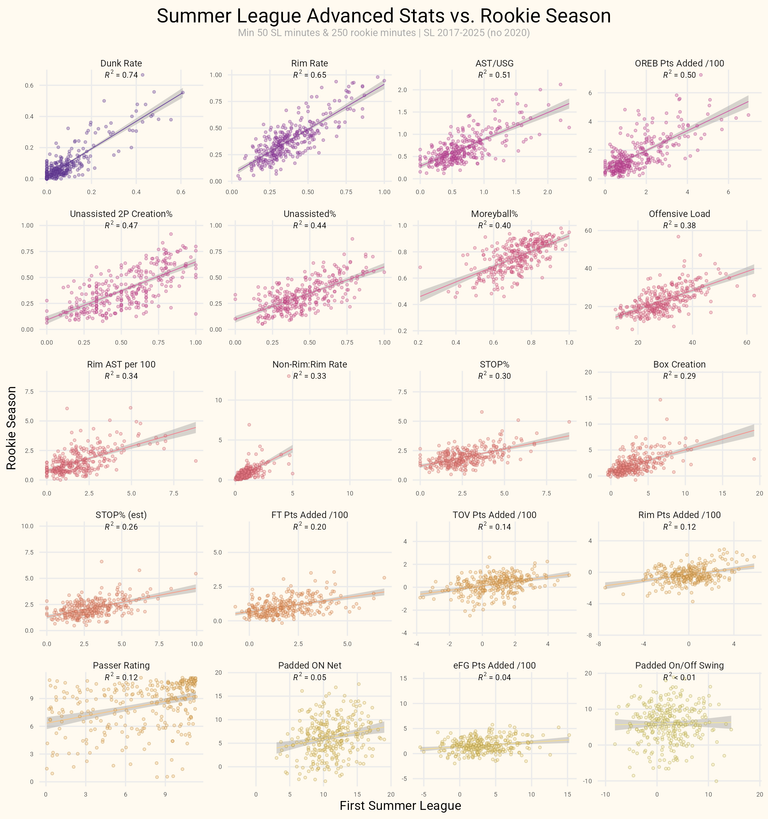
The chart above displays relationships between rookies' Summer League stats and their rookie season stats, reflected by their R-Squared values. R-Squared represents the amount of variation explained by a variable, which can be translated as the predictability of a SL stats' NBA translation. Because basketball is inherently a high-variance sport, you'll never see a R-Squared value close to 1 (the maximum amount of variation explained by a variable or collection of variables). A R^2 value greater than 0.25 is generally considered statistically significant.
The R^2 values tell us the same message the coaching staff of every Summer League team tells the players they’re investing development resources into. Refining the process is the goal of summer league, no matter how underwhelming the results. When we combine my outputs with Owen’s chart, we can observe that SL impact (on/off, net rating. etc.) is just as irrelevant as “results” (efficiency, etc.) but even the highly-specific measures of playstyle have high translatability. Summer League is about HOW you play, not HOW WELL you play. When a player's results are wildly disparate from their results in other pre-NBA settings, it’s worth examining whether there were any meaningful shifts in their process, whether it’s due to personnel changes, the system, health or most commonly, small-sample variance.
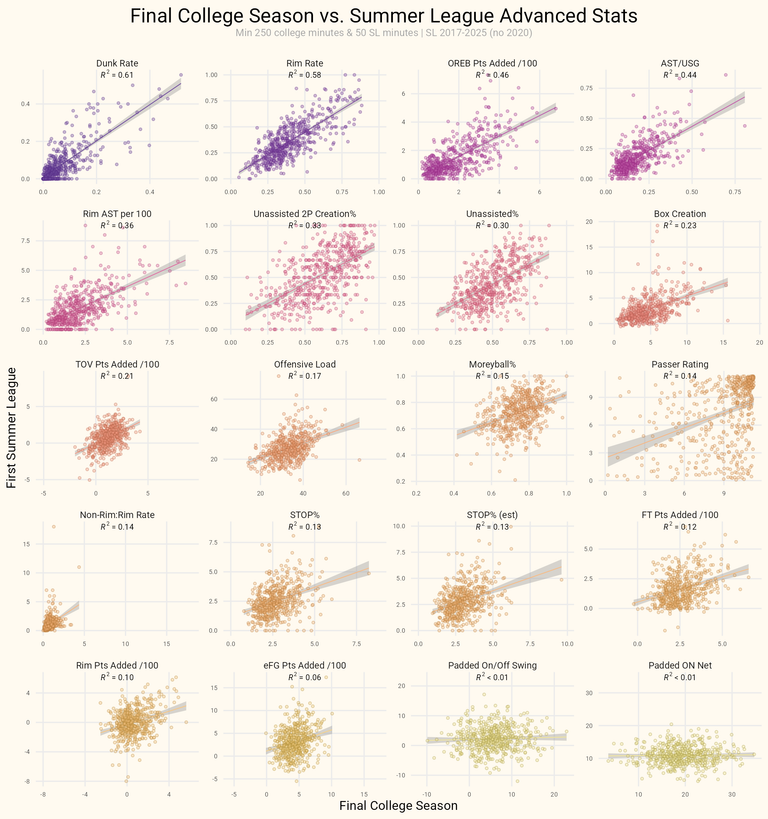
This chart performs the same analysis but instead of looking at SL to NBA translation, we're observing the predictability of rookies' collegiate stats in their pre-NBA year and their Summer League stats. We see an overall decrease in variation explained (R^2) but the general pattern of WHAT stats are the MOST predictable remains consistent.
"Sticky Stats"
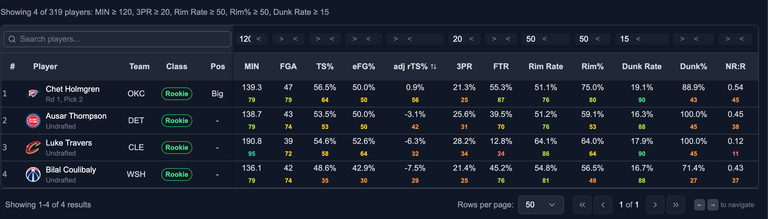
Dunk Rate & Rim Rate
SL games may not field 10 guys at the level of NBA players, but the high translatability of 2 of the most dependable indicators of applied athleticism — rim rate & dunk rate — suggests that if a player is athletic at any level, they're likely to approximate that footprint in the league. Some of this is because certain archetypes are compartmentalized to these rim-heavy shot profiles but the non-bigs who exhibit high rim/dunk rates also tend to do so in the NBA.
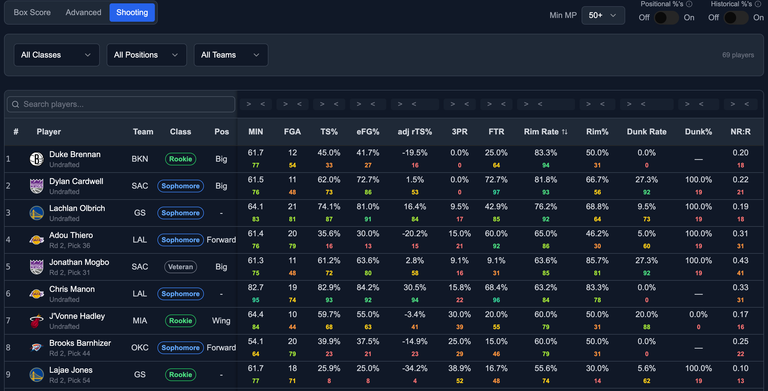
2026 rim & dunk rates2022 high dunk rate guys
Assist to Usage
The absence of touches, potential assists, passes & possession time stats at the collegiate level necessitates the use of Assist% to Usage% as a proxy for how a player balances their scoring & passing usage. This isn't a perfect crutch, as both Assist% and Usage% are outcome based stats but it's the best we've got[3]. AST/USG in Summer League grades out as the 3rd most sticky stat, which underscores its' usefulness as an identifier for players who pass more (or less) expected than their role/archetype. The higher the number, the more possessions a player uses to create opportunities for their teammates. Point guards typically lead in this stat, but it's also meaningful when players at positions that usually don't assume a heavy passing load (i.e. wing, big) are prolific passers relative to their usage. The 2 Dominicans [4]in the screenshot below present an interesting role malleability case.
Conversely, players who exhibit an unbalanced scoring tilt relative to their passing usage can bottleneck offenses if they don't pair that usage with efficiency. Kevin Knox & Miles Bridges are excellent examples of this signal from 2018 SL.
OREB PTS Added per 100
When I incorporated the Pts Added/100 stats into the analysis, I was anticipating OREB to outpace the other 3 factors based on Owen's results, but the extent to which OREB impact persists from SL to the NBA relative to FT, TOV & eFG impact is massive. This suggests that OREB impact is the most singularly stable influence a player can exhibit over the 4 factors that Dean Oliver proved most swing basketball games. Essentially, players that win the offensive rebound battle can do so more consistently & decisively than players who boost efficiency (eFG%), limit turnovers (TOV%) and get to the FT line.
If we think about this intuitively, it makes a bunch of sense. We already established that athletic & physical advantages persist with heavy confidence from Summer League to the NBA based on the R^2 values for rim rate & dunk rate. Of the 4 factors, OREB influence has the most direct tie with physical attributes. OREB influence is also the most independent area of control a single player can exert on a basketball game. If a player impacts efficiency by improving shot quality, that effect still relies on teammates to knock down shots. If they suppress turnovers at a high rate, they could face a defense that is hyper-aggressive. If they put pressure on the free-throw line, the ultimate decision to award them with foul shots lies in the refs' hands. There are so many extraneous variables suffocating the reliability of offensive impact on efficiency, turnovers & the FT line and even more of those variables on defense. The other 3 factors have far more variance than offensive rebounding, which often involves just 2 players.
The players that have mastered offensive rebounding are more likely to exploit that edge on a per-possession basis than the players that have mastered any other skill. It's why Mitchell Robinson is making $15 million dollars despite being a stark negative in every other offensive factor.
Steven Adams explaining his offensive rebounding strategy to maximise available angles when players try to box him out… pic.twitter.com/IH9uTU1kPv
Zuby, Dylan, Graham, Andersson & Tarris should have long NBA careers...
like Mitchell Robinson.
Unassisted 2P Creation & Unassisted%
The rate at which a player self-creates their offense was one of the largest differentiators in my archetype model & is a telltale sign of the type of usage a player can shoulder. Similar to Ast:Usage, these unassisted measures are a proxy for a players' self-creation load, as it can only confidently classify shots that were made field goals. Nonetheless, Peterson & Egor are marrying high-level efficiency while generating the majority of their buckets themselves.
Years before he became a back to back MVP and posted one of the greatest guard shotmaking seasons relative to shot profile ever, Shai Gilegous-Alexander was exhibiting his outlier 2PT self-creation ability in Las Vegas.
Moreyball%, Offensive Load, Rim Ast per 100, Non-Rim:Rim Rate, Box Creation
These stats are all varying ways to quantify playstyle, so it makes sense that they clear the R^2 threshold. They are also likely reflective of teams asking their prospects to play in Summer League in an archetype that will mirror their NBA archetype.
STOP%
I was asked on Twitter why steals and blocks are viewed so differently from a R^2 perspective, and it ultimately comes down to seals being much more easily juiced by nervous, developing ballhandlers.[5]
Why do you think there’s such a big gap between steals and blocks? Maybe lack of quality ball handling and spacing leads to fake steal totals?
STOP% incorporates steals, blocks and offensive fouls drawn, so it's a bit more predictive than steals alone, but the inflated steal totals drag down the reproducibility of some of the most prolific SL defensive playmakers. Malik Beasley is one such example, he followed up his immensely disruptive sophomore SL campaign with some of the lowest activity defensive playmaking at his position in the league.
The remaining stats fall below that .25 threshold should essentially be ignored. Even when players' net ratings are padded to try and account for SL small-sample variance, there is virtually no relationship between NBA net ratings. Any measure that includes an outcome should be dismissed until further validated over the course of a NBA season.
Darius Acuff posting a 42 TS% means a whole let less than his 8.8 TOV% on 40.6 USG%. Darryn Peterson's attempting just 13.5% of his FGA at the rim (39th%ile among combos), which is far more informative than him shooting 80% at the rim. As we enjoy this Summer league, keep these tenets in mind to maintain a calm, cool & informed perception of the NBA's future.
Explore all the historical SL PBP stats plus track daily performances from your favorite players on The 5th Factor.
The 5th Factor is now hosting my draft model outputs as well, which will be accompanied by a write-up over the next week!
Footnotes
↩this is a legitimately informative data point that has served as a harbringer for the end of NBA careers & the beginning of breakouts (i.e. Ajay Mitchell, Marjon Beauchamp, Egor Demin this year?)
↩in this instance, Yaxel is shouldering much more usage which makes his stellar AST/USG more impressive BUT Garcia's appearance is extremely notable nonetheless & in line with his other feel indicators on both ends of the floor
I’m a lifelong basketball enthusiast who blends film study and advanced analytics in my independent coverage of basketball and the NBA Draft across Tiktok, Twitter, Youtube, Substack and Instagram. I’ve also covered the Hawks for ~2 years as an accredited digital journalist for Afro News, and I am a member of the Atlanta Hawks’ Creators Collective.
-1600x900.png)




Comments